

Physics & Climate
e) Solar Influence
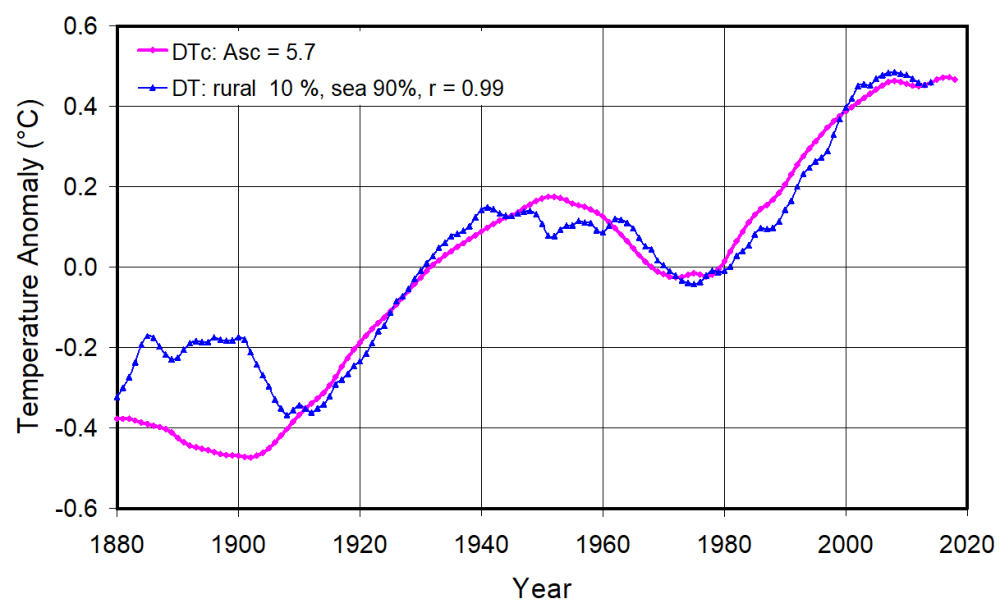
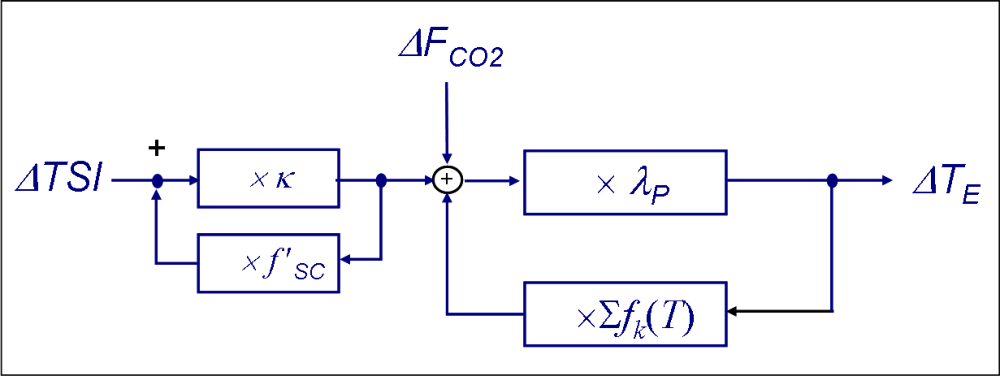
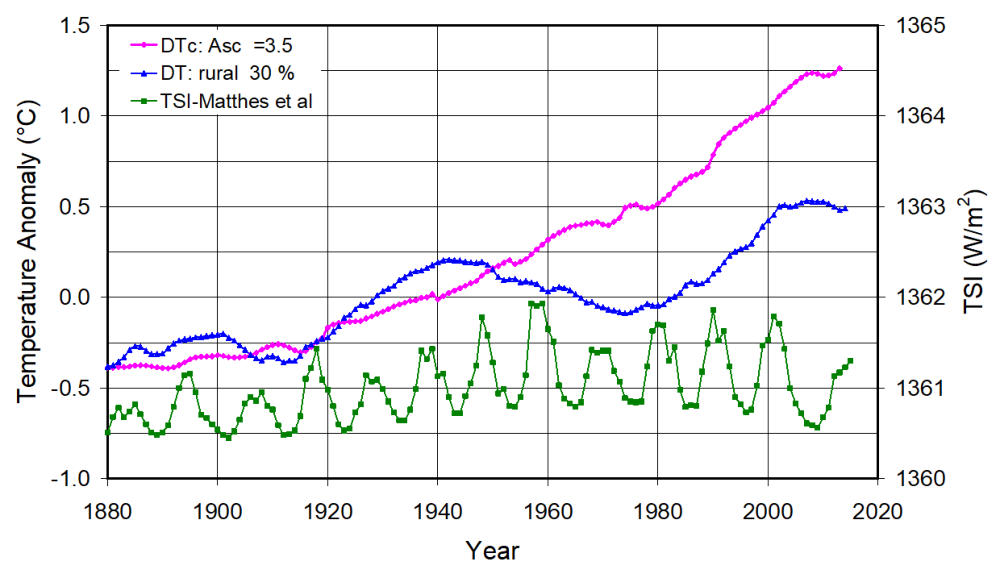
The Fifth and Sixth Assessment Report (AR5 and AR6) [1, 2]) of the Intergovernmental Panel on Climate Change (IPCC) announced new evidence of an anthropogenic climate change based on many independent scientific analyses from observations of the climate system, paleoclimate archives, theoretical studies of climate processes, and simulations using climate models. In these reports the IPCC classifies the human influence as extremely likely to be the dominant cause of the observed warming since the mid-20th century (e.g., AR5-WG1-SPM-D3), while contributions from natural forcings and internal variability would only likely be in the range of −0.1°C to 0.1°C. Particularly increasing emissions of carbon dioxide over the last century are made responsible for this change, and the Equilibrium Climate Sensitivity (ECS) as a measure for the Earth’s temperature increase at doubled CO 2 concentration in the atmosphere is specified with an assessed best estimate of 3°C and a likely range of 2.5°C to 4°C (high confi- dence, AR6-WG1-SPM, A.4.4). However, anthropogenic contributions to this warming are still quite contradictorily discussed, and because of the far reaching consequences for future climate predictions, above all, it is important to scrutinize, how far such an assertion of a pure anthropogenic climate change can really be confirmed by the increasing GH-gas concentrations, or how far also native effects like variations of the solar activity can explain the observed rising temperature. Also the impact of thermally and solar induced cloud cover changes, which affect our climate, but which are not always well understood, have to be considered with its implications on the observed tem- perature changes. Recently a researcher team of 23 experts in the fields of solar physics and climate science from 14 different countries published an extensive scientific study, in which they analyzed quite controversial datasets (Connolly et al. 2021 [3]). From these data they could explain global warming as anything from “mostly human-caused” to “mostly natural”, and they infer that the IPCC may have been premature in their conclusion that recent climate change is mostly caused by human greenhouse gas emissions. In another actual study (Harde 2022 [4]) we compare composed rural land and sea surface temperature measurements of the Northern Hemisphere (Soon et al. 2015 [5]) with simula- tions performed by an advanced 2-Lay- er-Climate-Model (2LCM) (Harde 2014 [6], Harde 2017 [7]), which allows to calculate the global temperature trend under the simultaneous impact of in- creasing CO 2 concentrations and solar variability. This model with its main features is briefly discussed together with the CO 2 radiative forcing, the solar radiative forcing and their specific feedbacks (see also: b) Climate Sensitivity, 2-Layer Model). This study covers simulations under quite contrasting conditions, on the one hand based on the model means of the Coupled Model Intercomparison Project Phase 5 (CMIP5) and Phase 6 (CMIP6), characterized by Equilibrium Climate Sensitivities of ECS = 3.2°C for CMIP5 and ECS = 3.78°C for CMIP6, on the other hand based on our own calculations of CO 2 radiative forcing with an ECS = 0.68°C. For the solar radiative forcing we consider six different Total Solar Irradiance (TSI) time series with significantly different trends, which with respect to their impact on global warming are subject of a further amplification by thermally induced feed- backs as well as solar induced cloud feedbacks (see diagram above). Together these amplifi- cations are denoted by the Equilibrium Solar Sensitivity ESS (temperature change at TSI = 0.1%) with values varying between 0.19°C and 0.9°C depending on the prevailing feedbacks. The amplification due to cloud changes was derived from observations within the Internatio- nal Satellite Cloud Climatology Project over the 1980s and 1990s (see: b) Climate Sensitivity, Clouds). From these simulations we see that under CMIP5/6 conditions with large thermal feedbacks but very flat solar variability the calculated temperature increase over the Industrial Era is di- stinctly larger than found from obser- vations. The left plot shows the calcu- lated temperature anomaly (Magenta Diamonds) for the model mean of the CMIP6 ESMs based on the TSI- time series of Matthes et al. (2017) [8] (Green Squares), which after averaging over the 11-yrs Schwabe cycles is characterized by a very flat trend. The composed temperature time series as a weighting of 30% rural land data (Soon et al. 2015 [5]) and 70% sea surface data (Kennedy et al. 2019 [9]) is displayed as Blue Triangles. Even CO 2 forcing alone contributes to a too large warming, in particular the observed domi- nant temperature variations over the last century with a broader dip over the 50s to 80s cannot be traced back only to CO 2 , which was only monotonically increasing over the considered period and mistakenly is assumed to be only of anthropogenic origin. On the other hand calculations relying on our own CO 2 radiative forcing data (Harde 2017 [7]) with significantly smaller thermal feedback but larger solar variability show excellent agree- ment with the land-ocean temperature composite (30% rural, 70% sea surface). So a simu- lation based on the TSI time series of Hoyt & Schatten (1993) [10] reproduces the stronger temperature drop over the 50s till 80s and also the total warming of about 0.9°C over the Industrial Era with a correlation factor of r = 0.95. A larger deviation is only found for the late 19th and early 20th century. Assuming a composed temperature series of only 10% land and 90% ocean weighting (left plot, Blue Tri- angles) and starting the comparison with the calculation (Magenta Dia- monds) at 1908, this correlation is almost perfect (r = 0.99), indicating a slightly larger sen- sitivity of our simulation to the sea surface temperature data. Consideration of additional forcings like the Atlantic Multi-Decadal Oscillation with its maximum phase at the end of the 19th century and a period of about 60 yrs as well as other native oscillations can further improve this agreement, but as long as their size and origin cannot better be identified, is solar radiative forcing and its amplification by induced cloud changes the most plausible explanation for the observed temperature changes, all the more also the other forcings more or less are expected to be controlled by the solar wind and super- posed planetary gravitational impacts (Mörner et al. 2020 [11]). From our calculations we derive a CO 2 affected portion to global warming over the Industrial Era of not more than 0.34°C and over the last century of only 0.24°C, which is 30% of the total warming, while apparently two thirds are caused by the solar impact. As human CO 2 emissions should not have contributed more than 15% to the increase over the Industrial Era (see: d) Carbon Cycle), the anthropogenic fraction to global warming is expected to be only 0.05°C.References
1. AR5 - Fifth Assessment Report: T. F. Stocker, D. Qin, G.-K. Plattner et al., Eds., Climate Change 2013: The Physical Science Basis, Cambridge University Press, New York, NY, 2014. https://www.ipcc.ch/report/ar5/wg1/ 2. AR6 - Sixth Assessment Report, IPCC, 2021: V. Masson-Delmotte, P. Zhai, A. Pirani et al.: Climate Change 2021: The Physical Science Basis. Contribution of Working Group I to the Sixth Assessment Report of the Intergovernmental Panel on Climate Change, Cambridge University Press. https://www.ipcc.ch/report/ar6/wg1/ 3. R. Connolly, W. Soon, M. Connolly, S. Baliunas, J. Berglund, C. J. Butler, R. G. Cionco, A. G. Elias, V. M. Fedorov, H. Harde, G. W. Henry, D. V. Hoyt, O. Humlum, D. R. Legates, S. Lüning, N. Scafetta, J.-E. Solheim, L. Szarka, H. van Loon, V. M. V. Herrera, R. C. Willson, H. Yan and W. Zhang, 2021: How much has the Sun influenced Northern Hemisphere temperature trends? An ongoing debate, Review article: Research in Astronomy and Astrophysics, Vol. 21, No. 6, 131(68pp), doi: 10.1088/1674- 4527/21/6/131, Download, http://www.raa-journal.org/raa/index.php/raa/article/view/4906/6081 4. H. Harde, 2022: How Much CO 2 and the Sun Contribute to Global Warming: Comparison of Simulated Temperature Trends with Last Century Observations, Science of Climate Change, vol. 2, no. 2, pp. 105-133, https://doi.org/10.53234/scc202206/10 Preliminary results were presented on the 2th International EIKE Klima- und Energiekonferenz, and 13th International Conference on Climate Change (ICCC-13), München, 23. a. 24. November, 2018, https://www.youtube.com/watch?v=ldrG4mn_KCs&feature=youtu.be 5. W. Soon, R. Connolly, and M. Connolly, 2015: Re-evaluating the role of solar variability on Northern Hemisphere temperature trends since the 19th century, Earth-Science Reviews, vol. 150, pp. 409–452. http://dx.doi.org/10.1016/j.earscirev.2015.08.010 6. H. Harde, 2014: Advanced two-layer climate model for the assessment of global warming by CO 2 , Open Journal of Atmospheric and Climate Change, vol. 1, no. 3, pp. 1–50, https://web.archive.org/web/20160429061756/http://www.scipublish.com/journals/ACC/papers/download/30 01-846.pdf 7. H. Harde, Radiation Transfer Calculations and Assessment of Global Warming by CO 2 , International Journal of Atmospheric Sciences, Volume 2017, Article ID 9251034, pp. 1-30 (2017), https://doi.org/10.1155/2017/9251034 8. K. Matthes, B. Funke, M. E. Andersson et al., 2017: Solar forcing for CMIP6, Geosci. Model Dev., 10, 2247, https://www.geosci-model-dev.net/10/2247/2017/gmd-10-2247-2017.pdf. 9. J. J. Kennedy, N. A. Rayner, C. P. Atkinson and R. E. Killick, 2019: An Ensemble Data Set of Sea Surface Temperature Change From 1850: The Met Office Hadley Centre HadSST.4.0.0.0 Data Set, Journal of Geophysical Research: Atmospheres 124, pp. 7719–63. https://agupubs.onlinelibrary.wiley.com/doi/full/10.1029/2018JD029867 10. D. V. Hoyt, K. H. Schatten, 1993: A discussion of plausible solar irradiance variations, 1700-1992, Journal of Geophysical Research: Space Physics 98 18895–906. https://agupubs.onlinelibrary.wiley.com/doi/10.1029/93JA01944 11. N.-A. Mörner, J.-E. Solheim, O. Humlum, S. Falk-Petersen, 2020: Changes in Barents Sea Ice Edge Positions in the Last 440 Years: A Review of Possible Driving Forces, Intern. Journal of Astronomy and Astrophysics, 2020, 10, 97-164, https://www.scirp.org/journal/ijaa.